| Solar Radiation Observations at 17:27 on 4/23/24 | |
|
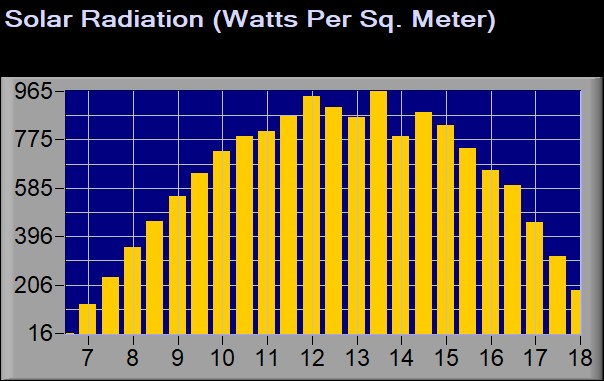
Data In this chart is from a Davis Vantage Pro weather instrument. The solar sensor is in an excellent location to receive direct solar energy all year. Only in May, June, July when the sun sets to the north of west there are some trees that filter the solar energy in the last hour before sunset. |
|
| Current Solar Rad. in Watts/Meters squared | 374 Time 17:27 |
| Past Hour Solar Rad. Rate of Change in Meters squared | -177 Time 17:27 |
| Solar Rad. 24 Hrs. Ago in Meters squared | 496 Time 17:27 |
| 24 Hrs. Solar Rad. Difference in Meters squared | -118 Time 17:27 |
| Parameter |
Maximum |
Average | ||||||
| Hourly Rate | 215 Time 8:46 |
|||||||
| Yesterday | 967 Time 11:35 |
|||||||
| Today | 953 Time 13:06 |
380 | ||||||
| Month | 1192 Date4/12/24 |
188 | ||||||
| Year | 1192 Date4/12/24 |
139 |
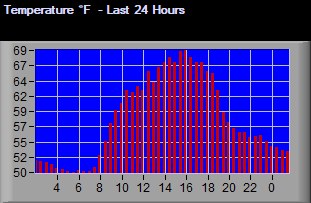
| Radiation Units - Watts per squared meter | Temp. Units - Degrees Fahrenheit |
 |
 |