| Current Weather Data As of 4:01 on 4/25/24 | |
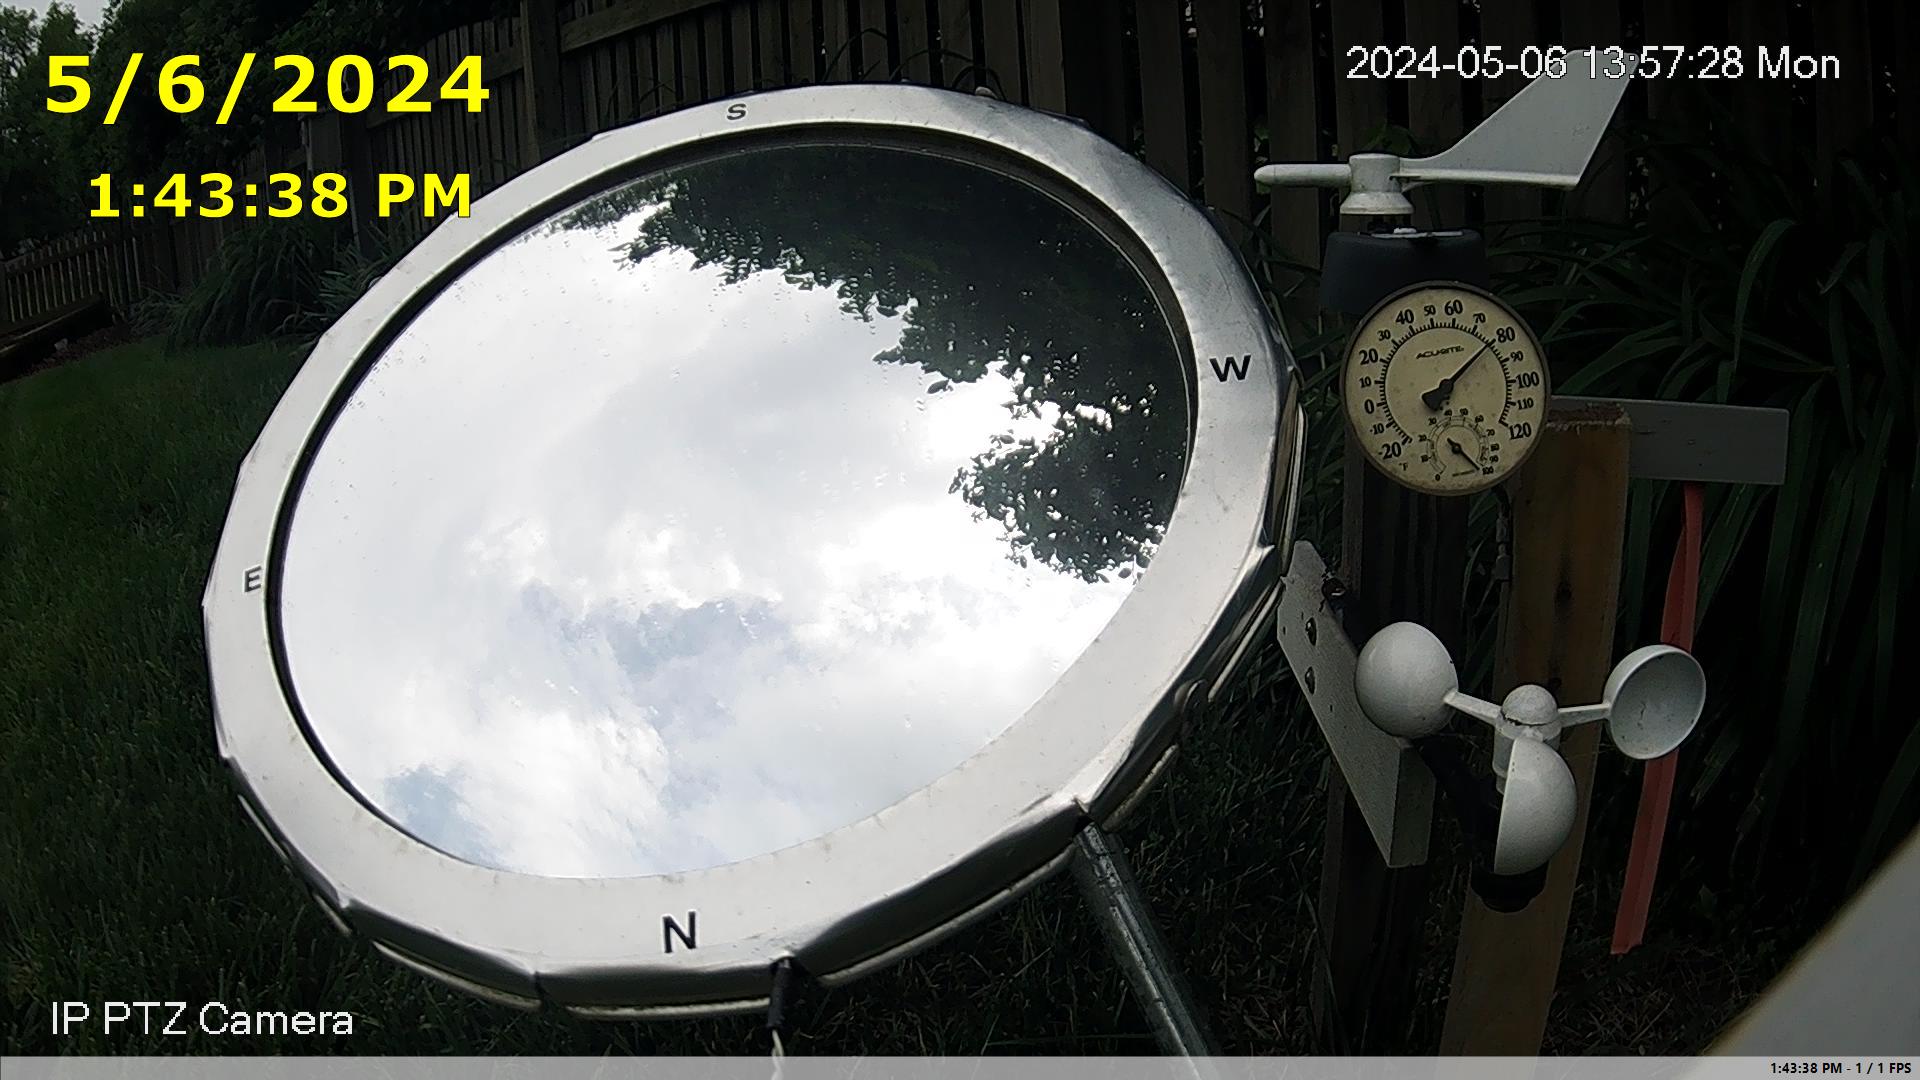
| The current sky during the day can be observed by looking at the sky mirror. | |
| LIVE SKY-VIDEO- (YOUR EYE TO THE SKY) | |
|
|
|
| Forecast Made By Vantage Pro Instrument Based Only On Current Obs. | |
| Mostly clear with little temperature change | |
| Current Weather Sky Mirror Click to enlarge. |
Heated Precip. Sensor Precip.=15 No Precip.=0 |
NOT Heated Dew & Precip. Wet=15 DRY=0 |
Time Since Last Measurable Precipitation |
Current Solar Radiation and Trend Past Hr. Today's Max. |
Glen Allen Temp. Trend Past Hr. |
 |
0 Now 0 Max 0:00 Time |
0 Now 15 Max 0:32 Time |
0 Watts/M² -0 Watts/M² 0 Watts/M² |
53.4 degs.F -0.82 degs.F Richmond Airport Temp. |
| Comfort Level- Cool |
Precipitation Rate- 0.000 inches |
Beaufort Scale- Light Breeze |
** Est. Cloud Base- 2197 FT |
| Heat Index 56.6 degs.F Wind Chill 52.8 degs.F |
Precipitation Last Hour- 0.00 inches |
Current Wind Gust- 5 MPH Past Hr. -2.3 MPH |
Barometer- 30.14 inches Past Hr. 0.017 inches |
| Dew point Temp.- 44.6 degs.F Past Hr. -0.83 degs.F |
Today's Precipitation- 0.00 inches |
Today's High Wind Gust- 15 MPH At 2:29 |
Today's Max. 1 Hour Change- 0.021 inches |
| Relative Humidity- 72 % Past Hr. -0.3 % |
24-Hour Precipitation- 0.00 inches |
Today's Ave. Wind Direct.- 331 Degrees Now NNW |
Barometer Trend- Rising |
|
**Virtual Wx. Station uses the formula Cloud Base(Ft)=250(Temp. - Dew Pt.) to estimate the height.
The Height that air contains a perceptible quantity of cloud particles to become visible.
This will be calculated even if conditions do NOT permit cloud formation. +The unit for solar radiation is Watts per Square Meter |
|||